Getting Started
Members Chat
Stocks Platform
Options Platform
News
Courses
Mobile App
Gamma Exposure
Gamma Exposure: Real-Time Indicator for Anticipating Stock Direction
In today’s fast-paced trading environment, having access to real-time data is crucial for making informed decisions. BlackBoxStocks’ proprietary Gamma Exposure indicator provides traders with up-to-the-minute insights, setting it apart from other gamma exposure indicators in the market.
Gamma Exposure offers a clear picture of how market makers are hedging to control risk, which can create buying and selling pressure on a stock. This invaluable information helps traders anticipate a potential directional move of a stock, giving them an edge over the competition.
Key Benefits of BlackBoxStocks' Real-Time Gamma Exposure Indicator:
- Real-time data: Unlike other gamma exposure indicators, our proprietary tool delivers real-time insights, enabling traders to make timely decisions based on current market conditions.
- Insight into market makers’ activities: Gain a clear understanding of how market makers are hedging to control risk and how their actions can create buying or selling pressure on a stock.
- Anticipate stock direction: Armed with the knowledge of market makers’ activities, traders can better anticipate potential directional moves in a stock, allowing for more strategic decision-making.
- Enhanced trading strategies: Integrate our Gamma Exposure indicator into your existing trading strategies to further refine your approach and capitalize on potential market opportunities.
With BlackBoxStocks’ real-time Gamma Exposure indicator at your fingertips, you’ll be well-equipped to anticipate stock movements and make informed trading decisions. Unlock the power of our proprietary tool and take your trading to the next level.
In Depth Explanation:
With BlackBoxStocks’ real-time Gamma Exposure indicator at your fingertips, you’ll be well-equipped to anticipate stock movements and make informed trading decisions. Unlock the power of our proprietary tool and take your trading to the next level.
Gamma represents the anticipated change in an option’s Delta with a $1 move in the underlying stock price. ATM options have the highest Gamma because their Deltas are the most sensitive to changes in the underlying stock price. This is because any movement in either direction will put the options contract ITM or OTM making the contract very sensitive to stock price movements.

In simple terms, Gamma measures how much an option’s Delta is expected to move when the underlying stock’s price moves up or down. The movement in Delta can cause market makers (or other market participants) to offset the option’s Delta change by trading the underlying stock in order to minimize their risk.
Market makers are often in options trades simply to facilitate the market. They do not have an economic interest in the trade. Therefore, while the market maker is in the trade, they will try to minimize their risk by Delta-hedging the options contract by trading the underlying stock. The market makers are looking to keep their net exposure at zero. When the underlying stock price changes, market makers must adjust their hedges by buying or selling the underlying stock because of the relationship between the option’s Delta and underlying price change’s impact on Gamma. The Delta hedges help the market maker avoid risk (also known as a Delta-neutral strategy).
Gamma Exposure can be long or short. When long Gamma, market makers will hedge their position by buying more of the underlying stock with each point the stock price falls (and visa versa). When short Gamma, market makers hedge by selling more of the underlying stock with each point drop in the stock price.
So why does this matter? Different market conditions expose market makers to Gamma differently, so they have to constantly adjust their hedges to control risk and this can create buying and selling pressure on a stock. The BlackBox Gamma Exposure chart study shows you the net Gamma exposure by looking at the sum of the OI gamma at each expiration for each strike. Note, Gamma Exposure can be overstated because written (selling) options contracts and advanced options strategies (e.g., spreads and other multi-leg options strategies designed to minimize risk), as these strategies are included in open interest but do not impact the market maker’s Gamma Exposure.
Let’s look at the Gamma Exposure on the SPY on 11/3/2022:
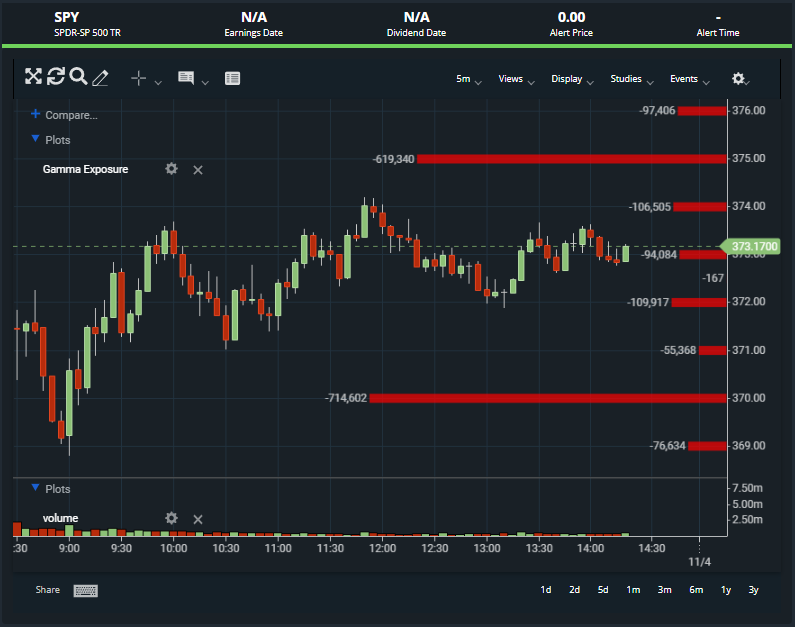
You can see, there is large Gamma Exposure at the $370 and $375 strikes. Fast forward to 11/4/2022 and the SPY hit a low of $370 and bounced, then it closed the regular market session at $376.35. However, most of the price action on the day was between $370 – $375.
To learn more about the Gamma Exposure study, watch this quick video: