Getting Started
Members Chat
Stocks Platform
Options Platform
News
Courses
Mobile App
Heat Maps
Visualize market data with BlackBoxStocks’ Heat Maps, offering an intuitive overview of sector performance and stock movements.

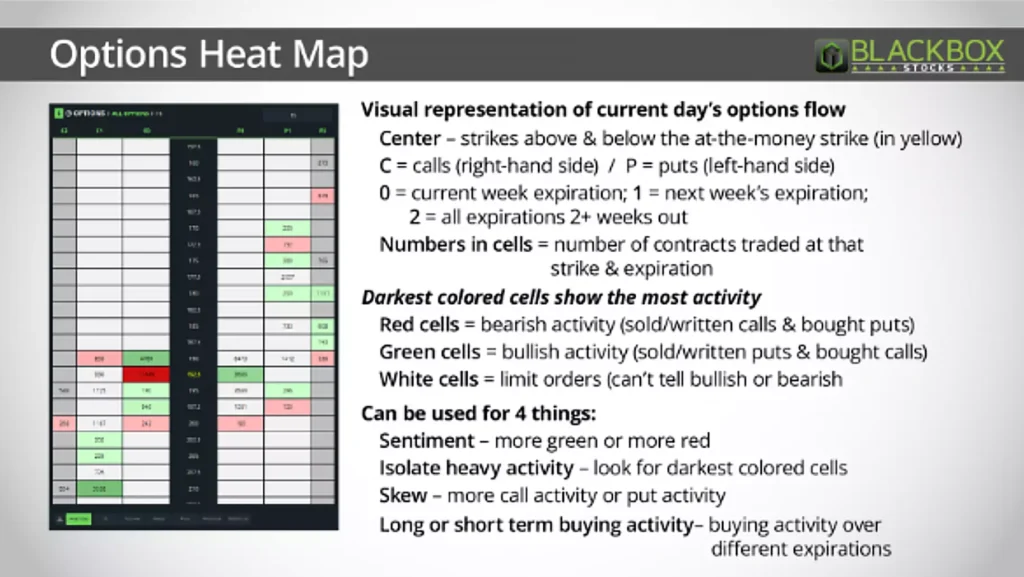
The Heat Maps feature on the BlackBoxStocks Options Platform is a powerful visual tool that helps traders quickly identify areas of high activity and gauge market sentiment for specific options contracts. By presenting complex data in an easy-to-understand format, heat maps enable you to spot trends and potential trading opportunities at a glance. Here’s what our Heat Maps feature offers:
- Visual Representation: The Heat Maps display options contracts data in a color-coded format, with varying shades representing different levels of activity. The darker the color, the higher the activity, making it simple to spot the most active strikes and expirations.
- Real-time Updates: Our heat maps are updated in real-time throughout the trading day, ensuring that you have access to the latest information on options contracts activity.
- Customizable Timeframes: You can choose to view heat maps for different timeframes, such as intraday, daily, weekly, or monthly. This flexibility allows you to analyze market activity over different periods and adjust your trading strategy accordingly.
- Filter by Underlying Stock: To focus on specific stocks, you can apply filters to display heat maps only for selected underlying stocks. This allows you to concentrate on the options contracts that are most relevant to your trading strategy.
- Comprehensive Data: The heat maps provide data on various parameters, including volume, open interest, and implied volatility. This wealth of information helps you gain a deeper understanding of the market dynamics and make more informed trading decisions.
- Gauge Market Sentiment: By analyzing the distribution of activity across different strike prices and expiration dates, you can gain insights into the market sentiment for specific options contracts. This can help you determine whether the market is leaning bullish or bearish, allowing you to align your trading strategy with the prevailing market mood.
- Identify Potential Opportunities: The heat maps can reveal areas of increased activity or unusual options trading, highlighting potential trading opportunities that may warrant further investigation.
In summary, the Heat Maps feature on the BlackBoxStocks Options Platform is an invaluable tool for traders looking to quickly assess market activity and sentiment in the options market. By providing a clear visual representation of options contracts data, heat maps enable you to spot trends and potential trading opportunities with ease, ultimately helping you make more informed decisions in your options trading journey.
