Getting Started
Members Chat
Stocks Platform
Options Platform
News
Courses
Mobile App
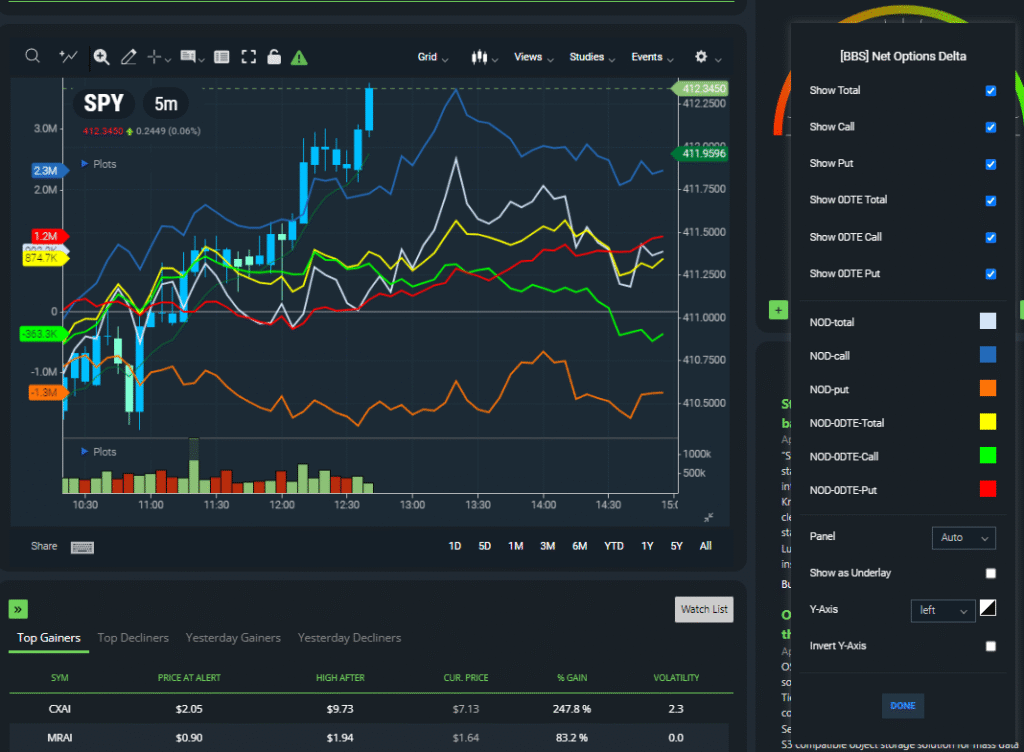
Net Options Delta
Discover the power of Net Options Delta (NOD) on BlackBoxStocks to identify potential directional trends in underlying equities. Master NOD today!
Net Options Delta: Understanding and Utilizing NOD on BlackBoxStocks
Net Options Delta (NOD): A Proprietary BlackBoxStocks Indicator
Net Options Delta, or NOD, is a proprietary indicator exclusive to BlackBoxStocks that provides valuable insights into the potential directional trend of an underlying equity. By analyzing the net options delta for calls, puts, and the total NOD, traders can make more informed decisions and enhance their trading strategies.
What is Net Options Delta (NOD)?
Net Options Delta is a measure of the difference between the total delta of call options and the total delta of put options. Delta, a key element of options trading, represents the rate of change in an option’s price with respect to the change in the price of the underlying asset. By calculating the NOD, traders can gain insights into the overall sentiment of the options market for a particular equity.
Understanding NOD Components
NOD is calculated by considering three key components:
- Call Delta: The total delta of all call options for an equity.
- Put Delta: The total delta of all put options for an equity.
- Total NOD: The difference between the call delta and the put delta.
Using NOD to Identify Directional Trends
The Net Options Delta can help traders identify potential directional trends in the market. A positive NOD value indicates that the call delta is higher than the put delta, suggesting a bullish sentiment. Conversely, a negative NOD value implies a bearish sentiment, as the put delta is higher than the call delta.
By monitoring the NOD, traders can gain insights into the overall market sentiment and make more informed decisions regarding their positions. It is essential to consider other factors, such as technical analysis and market news, when using the NOD as part of your trading strategy.
In conclusion, the Net Options Delta (NOD) on BlackBoxStocks is a powerful proprietary indicator that can help traders identify potential directional trends in underlying equities. By understanding and utilizing NOD, you can enhance your trading strategy and make more informed decisions in the options market.
In Depth Explanation
Net Options Delta is a calculation of the positive Call Delta plus the Negative Put Delta.
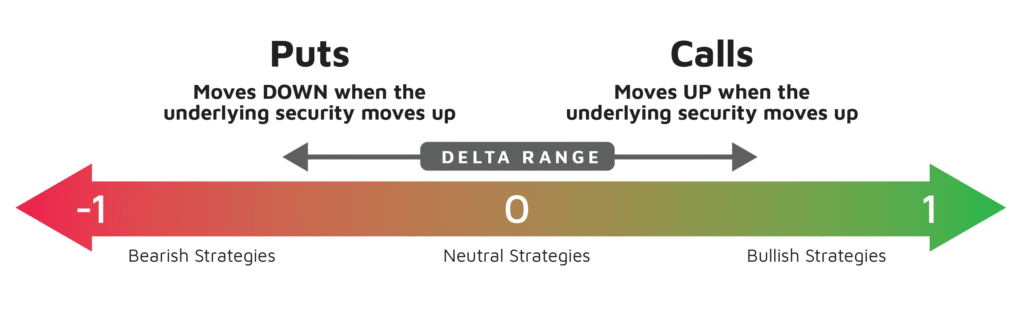
First, let’s quickly cover what Delta is. Delta is the first of the primary Options Greeks. Delta is the theoretical estimate of the change in an option’s value given a $1 move (up or down) in the underlying stock. Delta is positive for bullish strategies such as long stock, long calls, and short puts. Delta is negative for bearish strategies such as short stock, short calls, and long puts.
A positive net Delta position implies options market makers have a net long hedge. A net negative delta position implies options market makers have a net short hedge. Why does net Delta matter? When a large net Delta position expires, options market makers may have large hedges to unwind which may cause a reversal in the stock price. In simple terms, as more puts are being bought by traders, the market makers short the stock to hedge their net short put positions which creates downside price pressure on the stock. The opposite applies for calls being bought, the market makers buy more stock to hedge their net short call positions which creates upward price pressure on the underlying stock. The NOD study gives you a ‘behind the scenes’ look at what is happening.
The Net Options Delta (NOD) study analyzes the current day’s flow and provides a breakdown of the Net Options Delta for Calls, Puts, and the Total NOD.
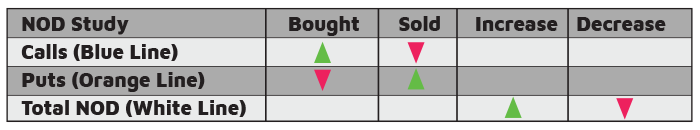
The lines in the study represent the following:
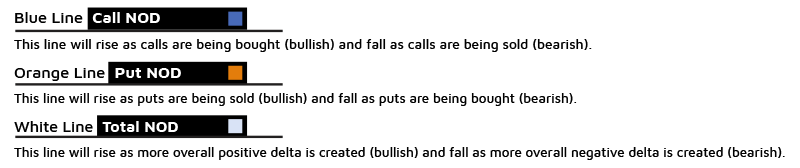
Let’s look at a few scenarios:
Scenario 1: 50 Delta call bought and 50 Delta put bought = Total Delta is 0 (Neutral – Blue line rises, Orange line falls, and White line is flat).
Scenario 2: 50 Delta call bought and 50 Delta put sold = Total Delta +100 (Bullish – Blue line rises, Orange line rises, and White line rises).
Scenario 3: 50 Delta call sold and 50 Delta put bought = Total Delta -100 (Bearish – Blue line falls, Orange line falls, and White line falls).
Summary:
So how do we use the Net Options Delta study? Let’s analyze the Net Options Delta study on NVDA on 11/3/2022:
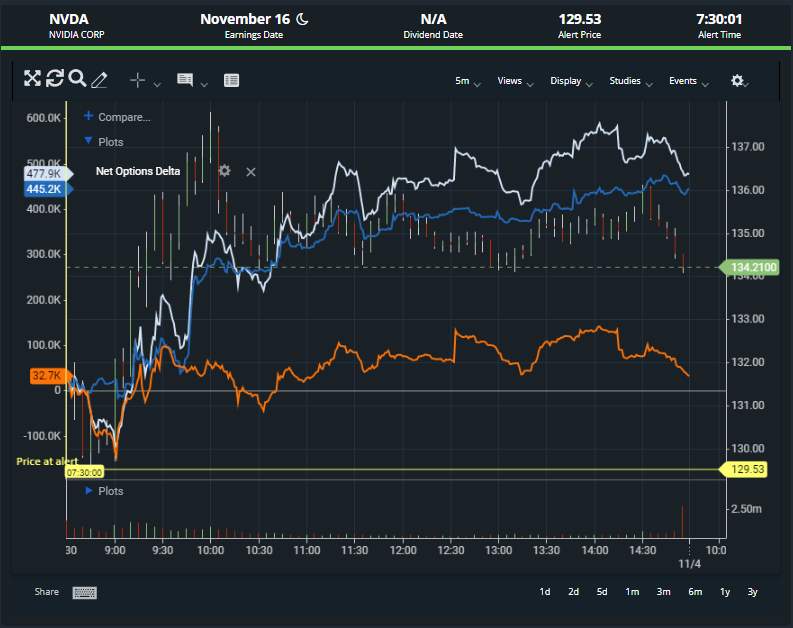
In the chart above, NOD is positive and it steadily increased throughout the day. Total NOD (White line) and Call NOD (Blue line) are both trending up. The PUT NOD (Orange line) is slightly positive and relatively flat indicating net selling of put delta.
A bullish correlation will be Blue, Orange, and White lines all moving up together and price action in the underlying stock moving upwards. A bearish correlation will have all three lines moving lower and the price of the underlying stock moving down. Divergences between the NOD lines and the price action can also be a contrarian indicator (For example, NOD moves higher but price action is making new lows, the options market is looking for a bounce as they can buy calls and sell puts).
0DTE Options Trading with BlackBox
Under the Net Options Delta Study you will find settings for 0DTE:
Watch our expert Team Traders explain how to use Net Options Delta