Getting Started
Members Chat
Stocks Platform
Options Platform
News
Courses
Mobile App
Options Dollar Flow
Discover our Options Dollar Flow indicator, showcasing net inflows and outflows of options contracts. Analyze short and long-term expirations to predict future price direction.
This study is designed to give you a visual representation of the net Options Dollar Flow for all options (both calls and puts) over the course of the day. The study shows the net difference between buys versus sells. We further break this data down into weekly and monthly expirations so you can see how money is flowing in or out of both shorter and longer expiration contracts.
The lines in the study represent the following:
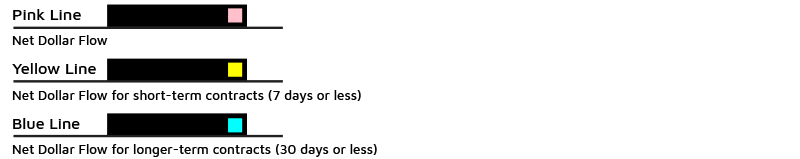
Positive study labels (left hand side of the chart) indicate overall net inflows
Negative study labels indicate overall net outflows
So how do we use this data?
Let’s analyze the Options Dollar Flow activity on SPY on 11/3/2022.
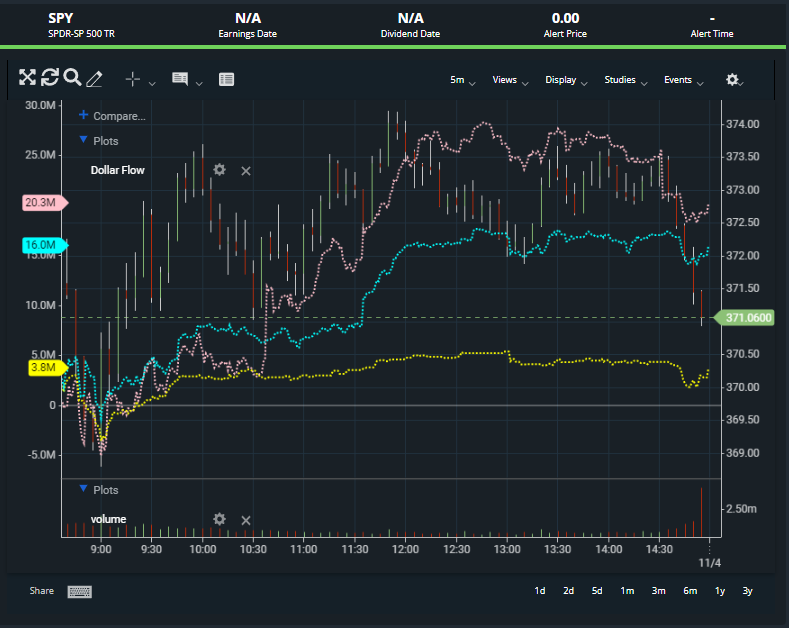
As you can see the chart, early in the morning all lines of the study were trending down as the SPY was trending down. Then around 9:00 (CT) the Total Net Dollar Flow (Pink) and Net Monthly Dollar Flow (Blue) started trending higher as the SPY price trended higher. At roughly 10:30 when the SPY retested a level of support, Pink line spiked and continued higher along with the Blue line but the Weekly Dollar Flow (Yellow) remained flat. The Dollar value is positive for all three lines indicating money is flowing into all expiration dates, however, significantly more money is flowing into longer dated options. Options traders appear to be expecting some short term consolidation and are looking for a move further out in time. All lines moved downward at the end of the day as the SPY trended down and traders closed positions to take profits.
The Options Dollar Flow study can show where money is going in the options market which can point to future price direction. The addition of short-term and long-term data provides insight into positioning at different timeframes.
For more information on the Options Dollar Flow study, watch this quick video:
PAGE CONTENTS
DOWNLOAD APPS