Getting Started
Members Chat
Stocks Platform
Options Platform
News
Courses
Mobile App
GoNoGo Trend
Utilize the GoNoGo Trend Indicator on BlackBoxStocks for easy-to-understand market trend analysis and trade decision-making.
Are you tired of cluttered charts and confusing indicator signals? We’ve got the perfect solution for you! Introducing the GoNoGo Trend® Indicator, now available on BlackBoxStocks. This powerful study simplifies chart analysis by combining multiple indicators into one easy-to-read color-coded system.
Understanding the GoNoGo Trend® Study
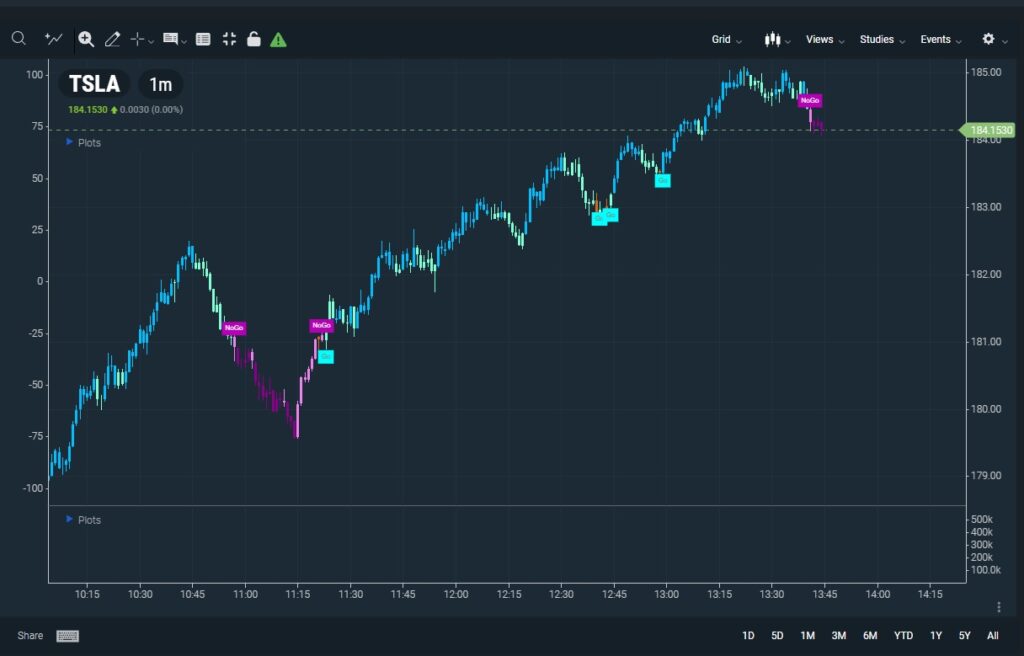
When you apply the GoNoGo Trend® study to your chart, you’ll see candles painted in five distinct colors: Purple, Pink, Orange, Aqua, and Blue. Each color represents a different level of trend strength:
- Purple: Strong No-Go (Strong bearish signals, not recommended to go long)
- Pink: Weak No-Go (Weak bearish signals, not yet suitable for long positions)
- Orange: Neutral (Mixed signals, wait for further confirmation)
- Aqua: Weak Go (Weak bullish signals, not recommended to go short)
- Blue: Strong Go (Strong bullish signals, not recommended to go short)
Trading with the GoNoGo Trend Indicator
The GoNoGo Trend® Indicator is not as simple as buying or selling when a specific color appears. To enhance your trading, consider using the GoNoGo Trend® in conjunction with multiple time frames. By examining the trend across various time frames, you’ll gain a better understanding of the overall market direction.
A top-down approach, starting with longer time frames, is often recommended since they tend to dictate shorter-term trends. For instance, if you notice a bullish signal on a smaller time frame, confirm that the larger time frame supports this trend before entering a trade.
Staying in the Trend
The GoNoGo Trend® study can help you stay in a trade and maximize profits. By focusing on the trend strength in longer time frames, you can avoid being shaken out by minor fluctuations in the shorter time frames.
Combining GoNoGo Trend® with Other Indicators
For added confirmation, you can use the GoNoGo Trend® study alongside other indicators, such as RSI, to identify potential trend reversals or confirmations. For example, if you spot a divergence between price and RSI, this could signal an upcoming trend change. You can then monitor the GoNoGo Trend® colors for further confirmation.
In summary, the GoNoGo Trend® Indicator on BlackBoxStocks can help you streamline your technical analysis by presenting a clear, color-coded system based on multiple indicators. By using this study in combination with multiple time frames and other indicators, you can make more informed trading decisions and enhance your overall trading strategy. Feel free to reach out to us with any questions or insights about using the GoNoGo Trend® Indicator. We’re always here to help!